Why home-price growth is still up 18% year over year

New listing data has fallen for 7 straight weeks.
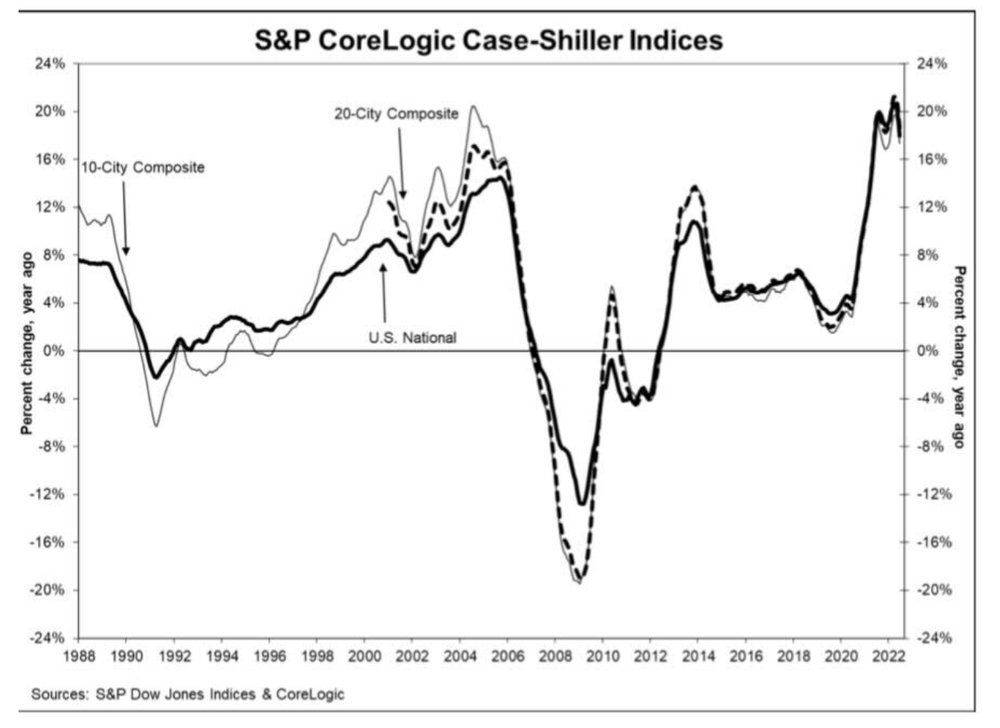
On Tuesday, the S&P CoreLogic Case Shiller Index reported that national home prices grew 18% year over year. While the growth rate is cooling monthly, we are still in a savagely unhhealthy housing market trying to get national inventory levels back to pre-COVID-19 levels.
From the index:
I know it seems strange, but existing home sales are falling, and the monthly supply of new homes is at 10.9 months even if the last existing home sales report showed home price growth of near 11% year over year.
There is a simple explanation for this, but you’re going to have to believe that supply and demand economics still work and that the credit profiles of homeowners matter more than people think. This means all those men and women since 2012 who have been saying its housing 2008 all over again on their YouTube, Twitter, Facebook and other social media outlets simply don’t have the proper training to talk about housing economics. I have documented the history of these housing price crash addicts for a decade now.
Housing inventory issue with no booming demand
My observation post-2020 is that many people have never read the total housing inventory data because we still have people who say active listings aren’t low or that it’s fake news. I understand why anti-Central Bank people say this because they want to blame everything on the Federal Reserve and say it’s just been booming demand.
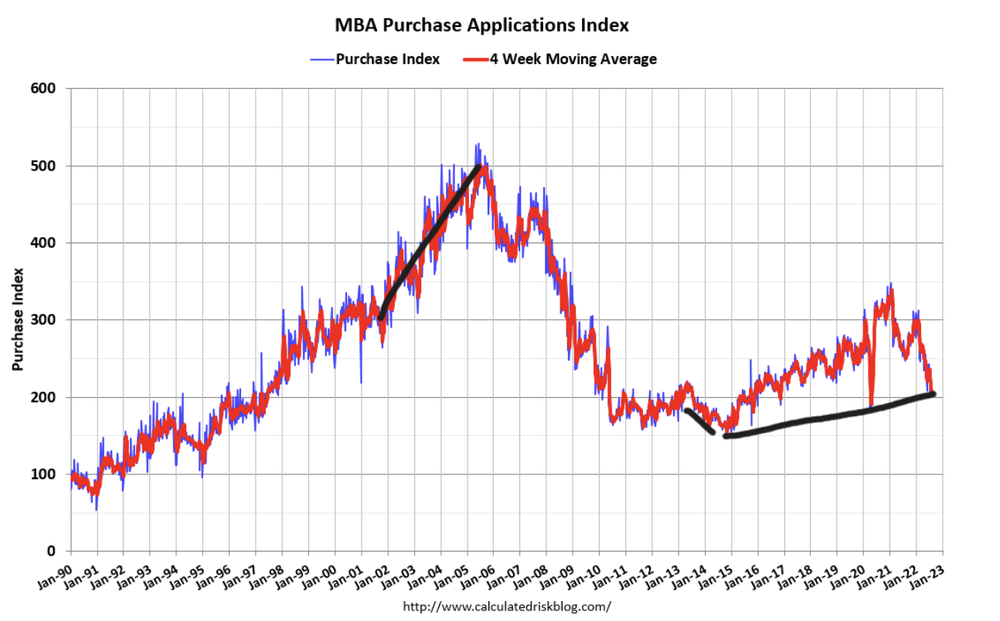
However, we haven’t had a credit sales boom like the one we saw from 2002-2005. Nor can we ever have a credit sales boom again with lending standards back to normal. Case in point, purchase application data is already below 2008 levels today.
Total Inventory had been growing from 2001-2005; total listings data in 2005 was at the higher historical range of 2.5 million listings. We broke to all-time lows post-2020, continuing the trend of lower inventory. Today, we stand at 1,310,000 active listings.
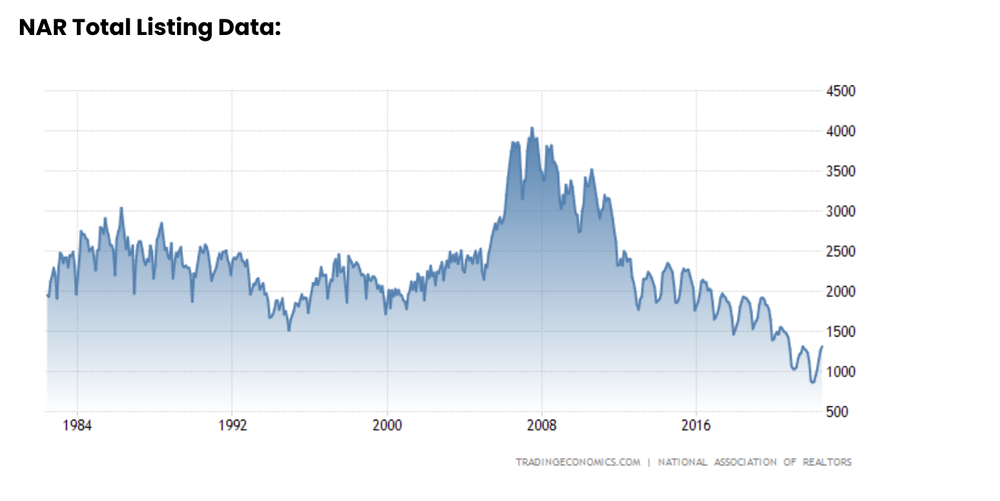
If we cut the timeline to the last time inventory grew, which was 2014, you can see this downtrend in inventory, unlike 2001-2005, when inventory grew from 2 million to 2.5 million. Inventory has been falling for years but people ignored the trend because some were always talking about the housing bubble 2.0 crash, especially from 2012-2019.
Then we can see a vicious break to all-time lows in 2020 when we didn’t have a seasonal push in inventory, and even today, with the weakness in home sales, we aren’t back to the range I believe would be ok, between 1.52-1.93 million. I don’t need to see total active listing get back to the historical range of 2-2.5 million to take the savagely unhealthy theme off, but I do need us to get into a range between 1.52-1.93 million, like I have talked about for some time now.
New listings are declining now
One of the issues with existing home inventory has been that, for the most part, a traditional seller is usually a buyer of a home. I am not talking about investors; I am talking about primary resident homeowners. Some sell to rent, of course. However, traditionally speaking, they buy a home.
One of the points of concern this year has been that when rates got toward 6%, this could potentially have new listings decline faster than normal because buying a home after selling might not be the best financial decision. Inventory is always seasonal, but the decline in new listings this year was not what I wanted to see. The decrease also happened when rates fell 1.25% from the recent highs of 6.25% back down to 5%. This is not encouraging news at all, in my view.
Read the full post on Housing Wire
If there is a home that you would like more information about, if you are considering selling a property, or if you have questions about the housing market in your neighborhood, please reach out. We’re here to help.

